



A football price shows just one moment in a changing market. OddsPlot.com is a service for tracking bookmaker odds movement in football. It collects odds and presents their history as graphs, allowing readers to see when a price changed and how its path developed before or during a match.
The interface combines a match list, filters and individual charts with tools for organising observations. This makes it relevant to football data researchers, line watchers and anyone keeping a detailed match journal. Its subject is market movement; the charts do not explain every change or predict a result.
What an odds chart adds to a price table
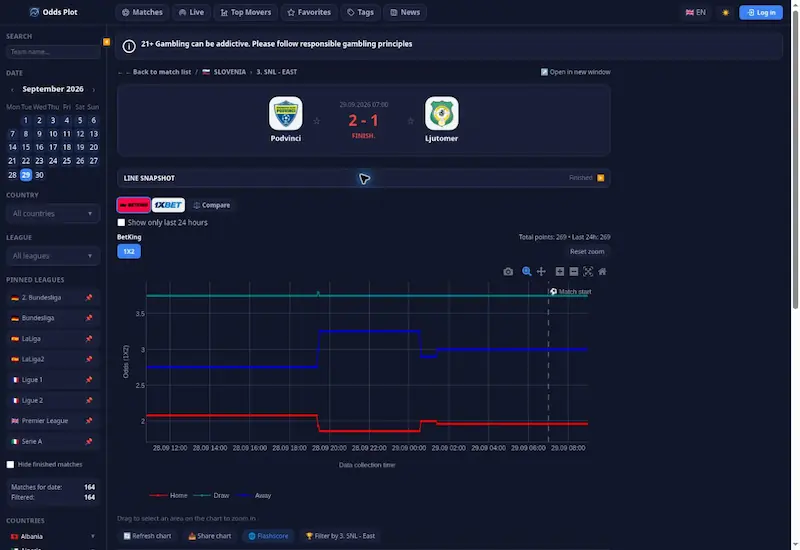
A typical odds comparison page focuses on prices available from different bookmakers. A history chart adds a time axis. It shows whether a line stayed flat, moved in steps or reversed direction. Two identical current prices can therefore have very different histories.
OddsPlot displays markets including 1X2, both teams to score and over/under 2.5 goals. The match view includes bookmaker controls and a snapshot of opening and current odds, with percentage deviations. On the chart, labels distinguish the outcomes, while zoom controls allow a closer look at a selected period.
Read the chart axes before drawing a conclusion. The time axis refers to when the data was collected, while the other axis shows the odds. A flat line means that no change is shown in that series for that span; it does not prove that every other bookmaker kept its price the same.
Finding matches without losing context
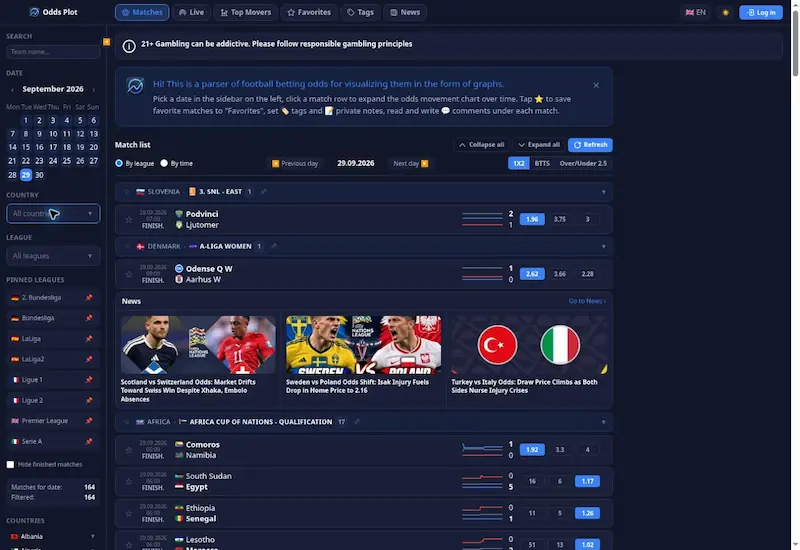
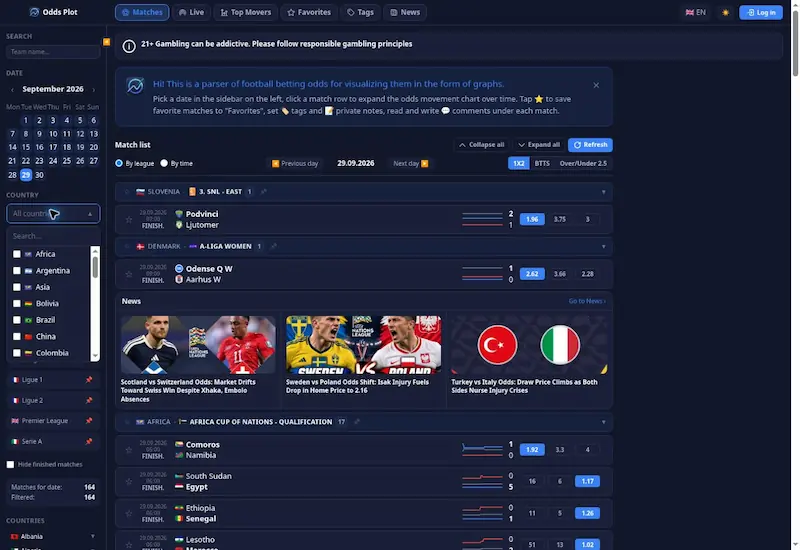
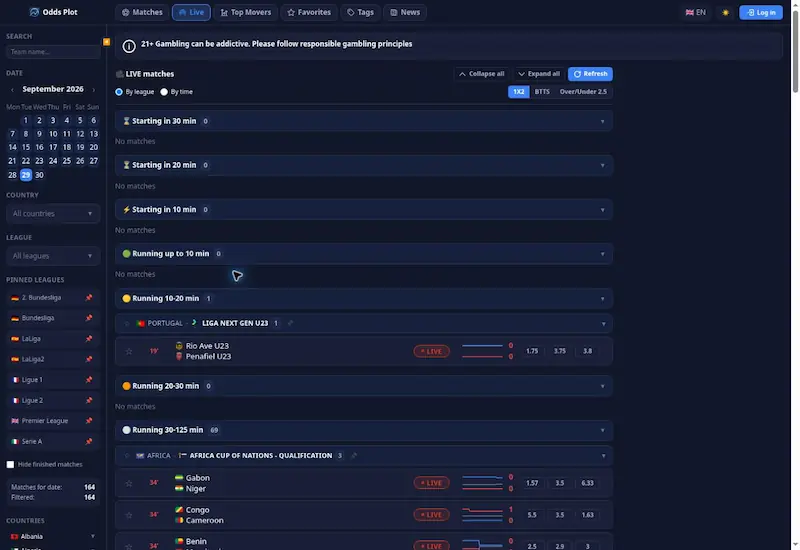
The main page places a calendar and filters beside the fixture list. Country and league selectors narrow the display, while the search field helps locate a team. Matches can be grouped by league or time, and pinned leagues provide another navigation shortcut.
- Date selection defines which day’s matches appear.
- Country and league filters reduce the size of the list.
- The option to hide finished matches changes what remains visible.
- Market selectors switch between the types of odds displayed.
The distinction between a list and a chart is useful: the list provides an overview, while opening a match reveals its recorded price history. Neither screen needs to carry every detail at once.
Top Movers and Live show different views
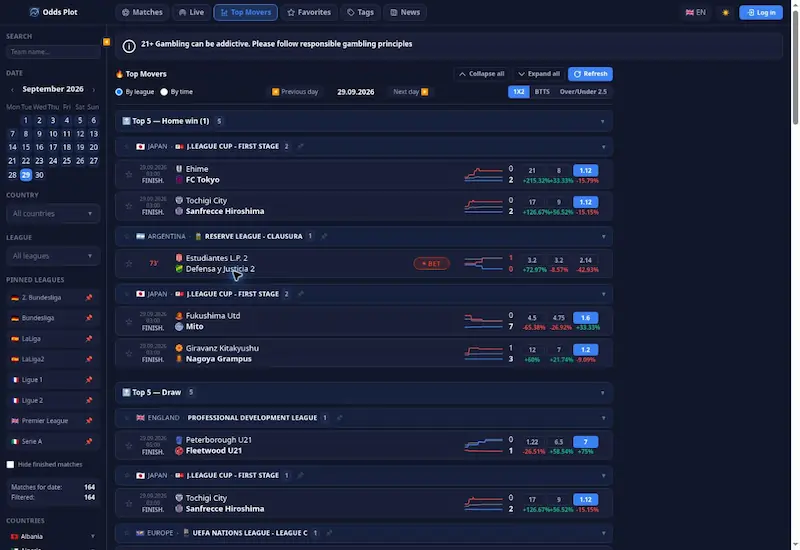
The core function is described as Odds Plot – parser of football betting odds for visualizing them in the form of graphs. The Top Movers section, reached through the Top Deviations URL, groups matches with substantial recorded changes and displays percentage movements alongside their prices.
A large deviation is a description of the data, not proof of inside information or a reliable forecast. The chart may show when an adjustment occurred, but identifying its cause requires evidence outside the price history.
The page titled Live odds movement: football matches right now · Odds Plot focuses on the live match view. Its interface groups fixtures by timing, including matches approaching kickoff and games in progress. This separates a changing live schedule from the broader daily list.
Stars provide access to Favorites, while match pages include Tags, Note and Comments controls. These features serve different purposes: a saved match is easy to revisit, a tag adds a category, and a private note records an observation. Comments are a separate discussion area.
In the guest interface, adding favorites, private tags or notes requires login. Posting comments also requires an account. The public charts can be inspected separately, so the available viewing tools should not be confused with account-based record keeping.
A note can hold the time of a change, the market shown and a link to a source used to check the match context. Tags can group records by league or research topic. This gives a journal a clear structure and keeps facts apart from guesses made after the final score is known.
A short walkthrough of the interface
- Select a date in the sidebar calendar.
- Find a fixture through search or the country and league filters.
- Open the match and inspect the chart, legend and time range.
- Use the star, tag or note controls when signed in to organise the record.
For a clear journal, separate what the graph shows from what a reader thinks caused it. A timestamped observation such as “the line changed before kickoff” is different from an unverified explanation. Keeping that distinction makes later review more useful.
Understanding the limits of the display
OddsPlot’s distinguishing feature is the visual history of football prices. That history can support descriptive research, but it cannot establish positive expected value, or +EV, by itself. Recorded movement is not a guarantee of accuracy, future direction or profit. The service is best understood as a way to view and organise market data, with the underlying uncertainty still intact.
